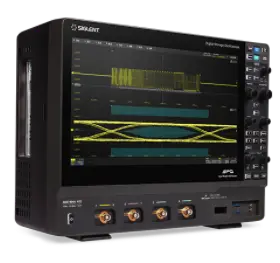
 High Resolution Oscilloscope
 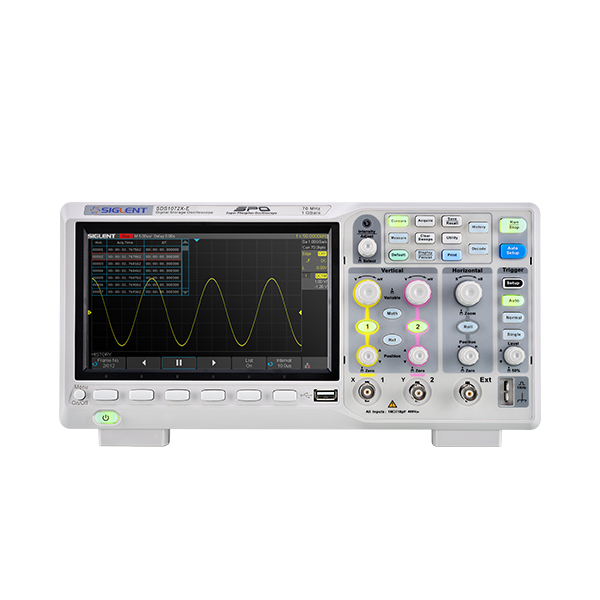 Digital Oscilloscopes
 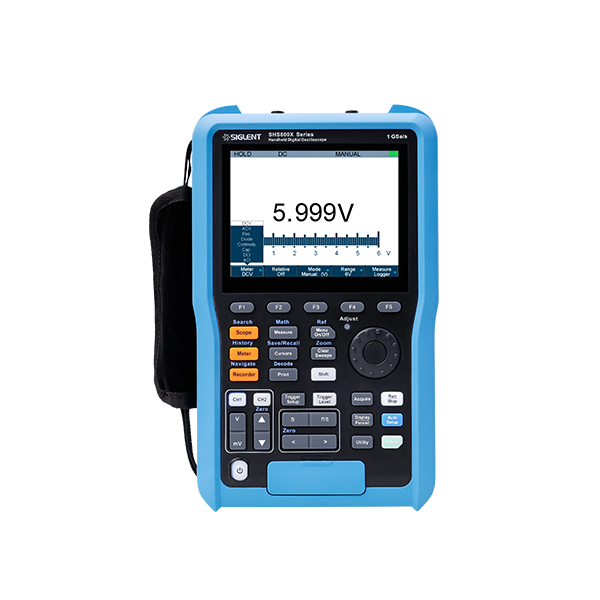 Handheld Oscilloscopes
 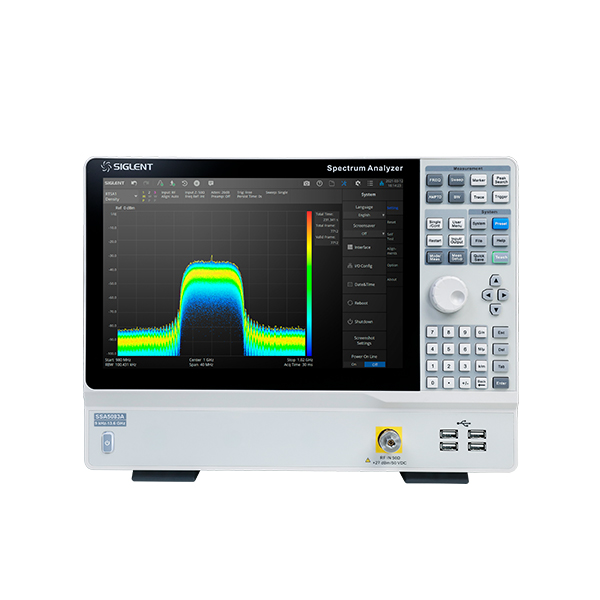 Spectrum Analyzer
 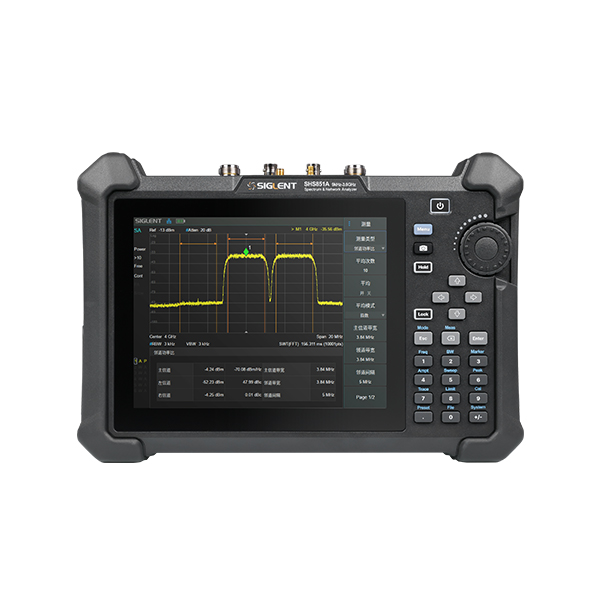 Handheld Spectrum Analyzers
 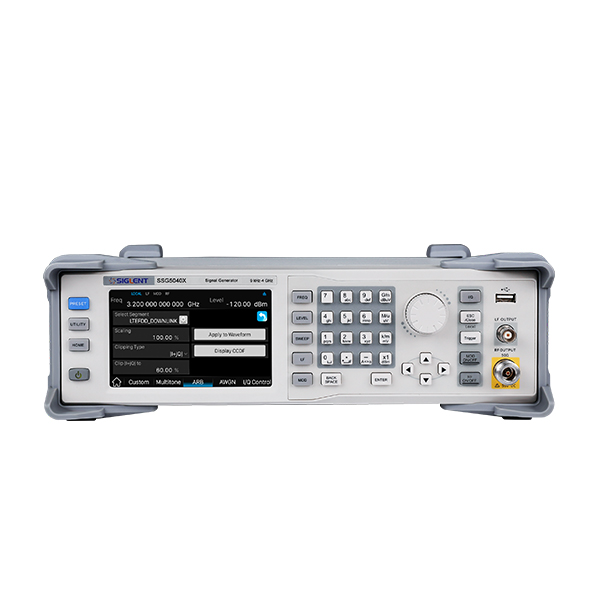 RF Siqnal Source
 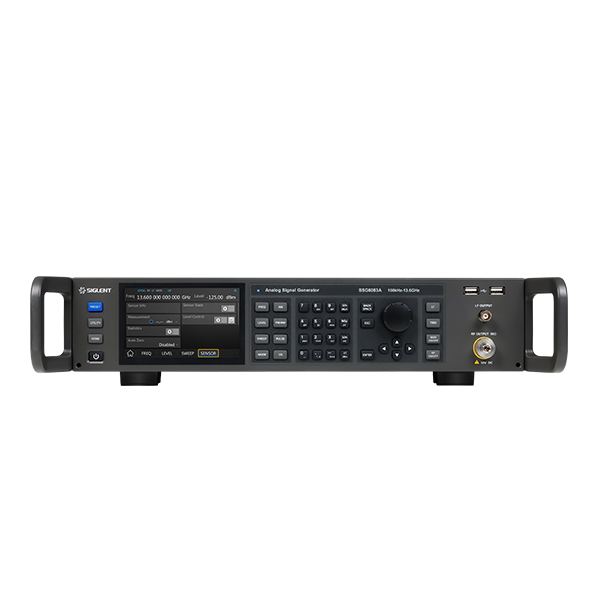 Vector Signal Generators
  Vector Network Analyzer
  Handheld Vector Network Analyzer
  Waveform Generators
  Linear power Supplies
  Electronic Loads
 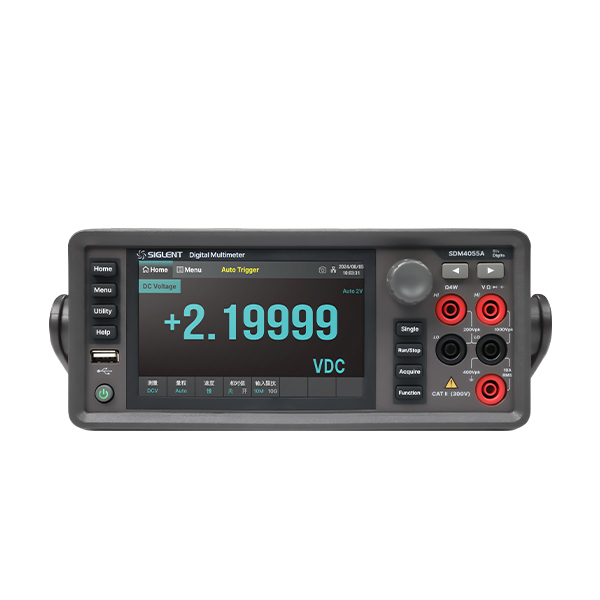 Digital Multimeters
 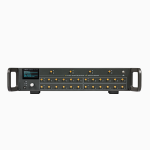 Switch Matrix
  Mechanical Switch
 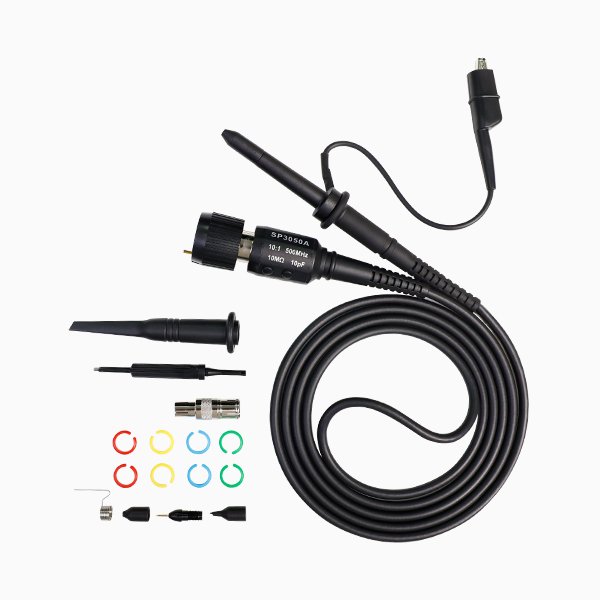 Probes
  Reference Source
  Test Fixture
  Calibration Kits
  External Protective Accessories
  Cables and Adaptor
  Antenna
  Frame
Frame 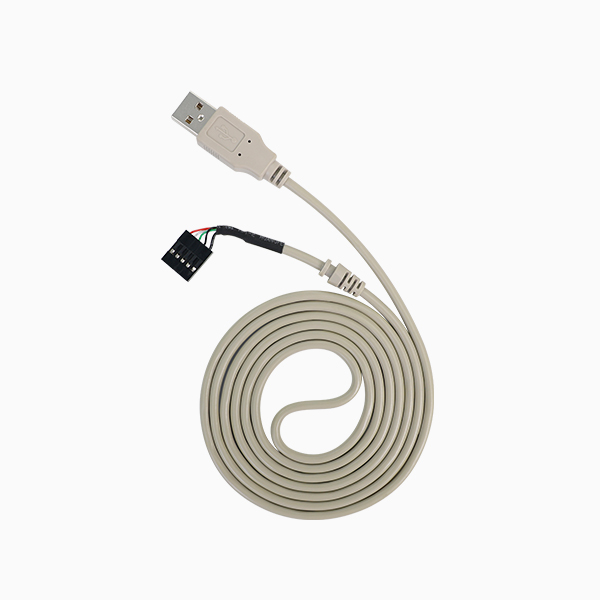 Other Accessories
 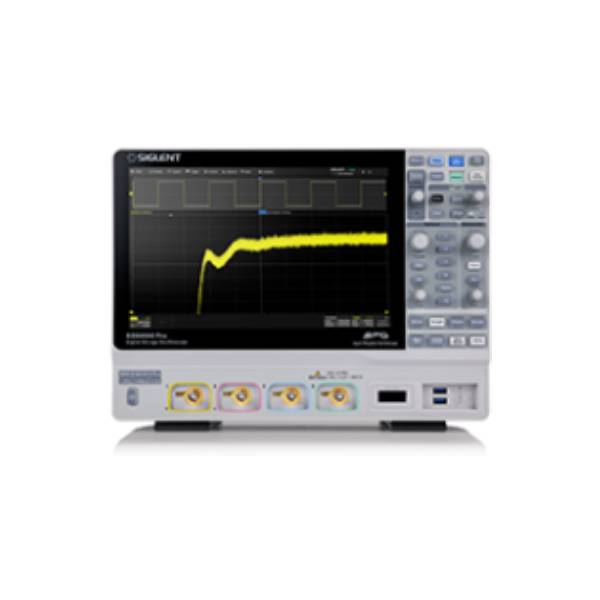 Bandwidth/Channel Update Options
 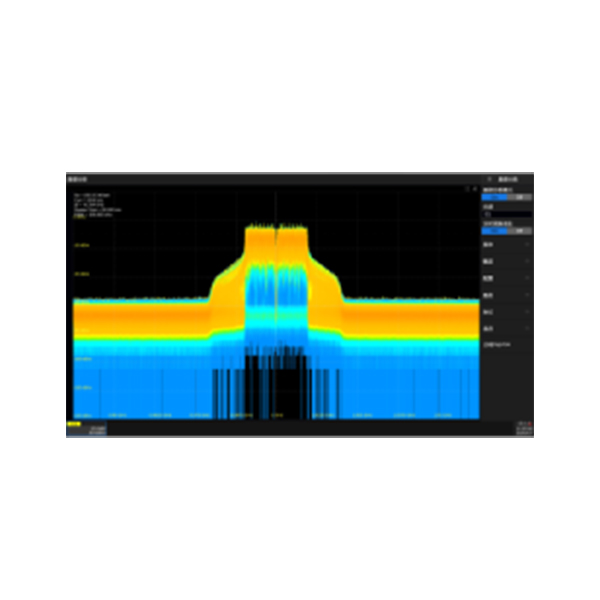 General Analysis Options
 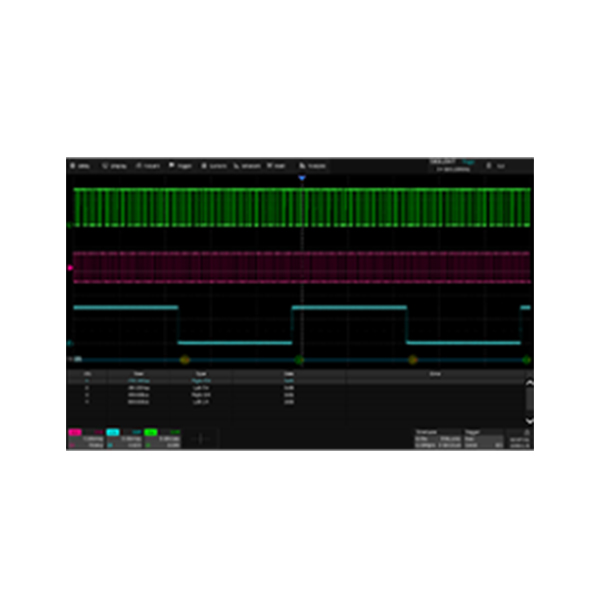 Trigger/Decode Options
  Compliance Test Application Options
 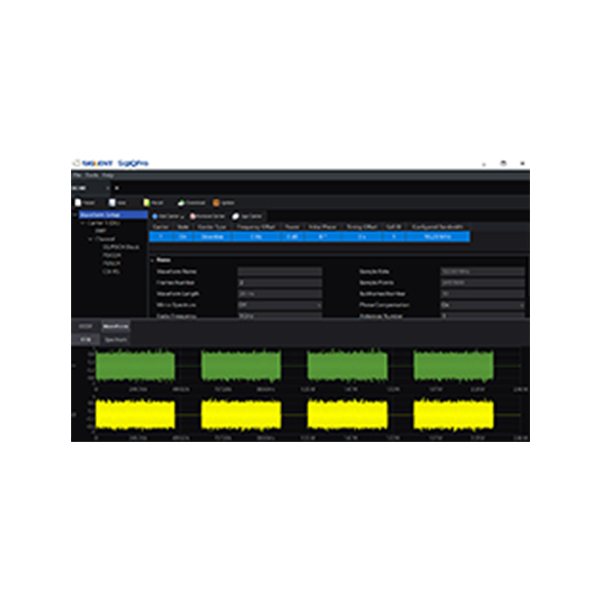 SigIQPro Signal Generation Software
  Other Options
 Solution
Solution
Bode Plot Solution
The Bode plot was invented in 1930 by Dutch-American scientist Hendrik Wade Bode. This simple yet accurate method graphically characterizes gain and phase.
Bode plots are commonly used for analyzing system frequency response characteristics. In AC signal processing circuits, signal frequencies may range from Hz to kHz and even MHz levels, and voltage gain may vary from a few times to over a million. Bode plots allow these wide variations to be clearly represented on a single set of logarithmic axes. 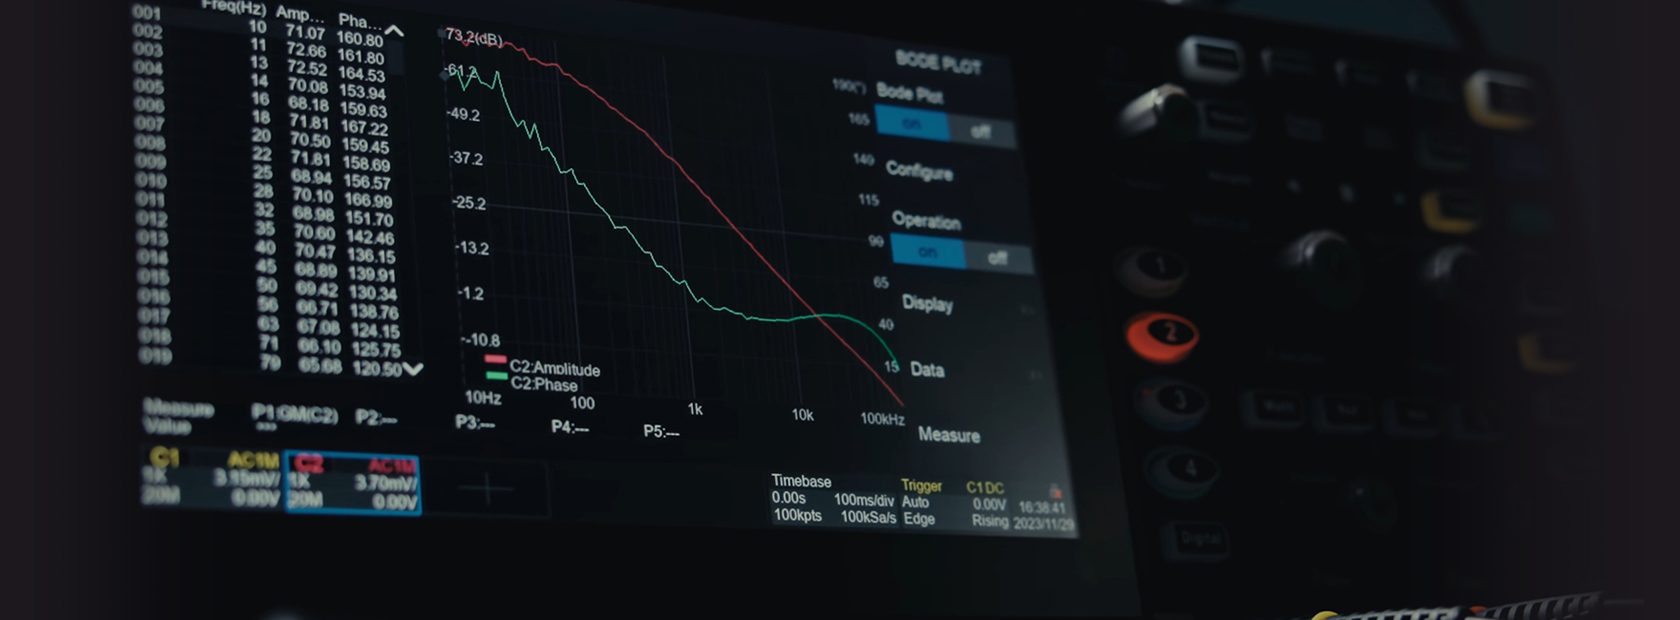
Scenarios
-

Power Loop Analysis
-

System Frequency Response Analysis
-

PSRR Measurement
Solution